Research Article
Role of Dietary Macronutrients and Fatty Acids in Obesity and Metabolic Risk in Older Adults
1University of Maryland School of Medicine, Baltimore, USA
2VA Research Service, VA Maryland Health Care System, Baltimore, USA
3Department of Medicine, Division of Gerontology and Geriatric Medicine, University of Maryland School of Medicine, Baltimore, USA
4Baltimore VA Medical Center Geriatric Research, Education and Clinical Center (GRECC), Baltimore, USA
*Corresponding author: Alice S Ryan, Professor, Division of Gerontology and Geriatric Medicine, Baltimore Veterans Affairs Medical Center, Baltimore, USA, Tel: (410) 605-7851, Fax: (410) 605-7913, E-mail: aryan@som.umaryland.edu
Received: April 11, 2019 Accepted: July 19, 2019 Published: July 29, 2019
Citation: Dooley C, Ryan AS. Role of Dietary Macronutrients and Fatty Acids in Obesity and Metabolic Risk in Older Adults. Int J Obes Nutr Sci. 2019; 1(1): 6-10. doi: 10.18689/ijons-1000102
Copyright: © 2019 The Author(s). This work is licensed under a Creative Commons Attribution 4.0 International License, which permits unrestricted use, distribution, and reproduction in any medium, provided the original work is properly cited.
Abstract
The aim of the study was to examine the role of dietary consumption of different types of fatty acids on metabolic risk factors and regional fat deposition in older men and women. We hypothesized that saturated fatty acid (SFA) intake, monounsaturated fatty acid (MUFA) and low intake of polyunsaturated fatty acids (PUFA) would be associated with markers of insulin resistance, hyperlipidemia, and hypertriglyceridemia. Sedentary, overweight and obese (body mass index: 29-48 kg/m2) adults (N=20) aged 45-78 years underwent two-hour oral glucose tolerance test, blood draw, DXA scan, and completed seven-day diet records. Subjects had low fitness levels (VO2 max=23.5 ± 2.4 mL/kg/min) and high total body fat (43.5 ± 1.7%). The average macronutrient composition of the diet was high in fat as a percent of total kcal (35.5%). The ratio of MUFA to PUFA was associated with serum cholesterol (r=0.48, P=0.03) and tended to be associated with higher fasting glucose (r=0.42, P=0.06) and glucose at 120 min (r=0.43, P=0.06). PUFA intake as a percentage of fat intake was associated with lower serum cholesterol (r=-0.44, P=0.05). Therefore, dietary MUFA intake unbalanced by PUFA may confer increased risk for diabetes among obese, sedentary individuals. Future investigation of food sources, or context of dietary lipids, could lead to individualized dietary recommendations to promote healthy eating habits and potentially alter metabolic risk.
Keywords: Hyperlipidemia; Macronutrients; Fatty acids; Diabetes; Obesity.
Abbreviations: AEX: Aerobic Exercise; BMI: Body Mass Index; OGTT: Oral Glucose Tolerance Test; AUC: Area Under Curve; TLC: Therapeutic Lifestyle Changes; MUFA: Monounsaturated Fatty Acid; PUFA: Polyunsaturated Fatty Acid; SFA: Saturated Fatty Acid; LA: Linoleic Acid; EPA: Eicosapentaenoic Acid; DHA: Docosahexaenoic acid; DRI: Dietary Reference Intake; AMDR: Accepted Macronutrient Distribution Range; AI: Adequate Intake; UL: Upper Limit.
Introduction
Dietary fat composition is highly modifiable, and possibly one of the most important factors influencing insulin resistance and blood cholesterol. In the last several decades, unsaturated fatty acids have gained importance as a dietary component that could prevent chronic disease, with saturated fats generally regarded as detrimental to oneʼs health [1]. Dietary fatty acids determine plasma availability and tissue storage of lipids, and have long been speculated to exert an effect through altering cell membrane composition and function particularly in skeletal muscle, as well as gene expression, enzyme activity, and immune cell function [2-6].
Several large epidemiological studies support the association between dietary saturated fat intake and type two diabetes risk [7-9].In a large prospective study, development of diabetes over nine years was associated with saturated fatty acid (SFA) in serum cholesterol and phospholipids with adjustment for diabetes risk factors [10]. A large prospective case-cohort study of Pima Indians demonstrated an association between dietary fatty acids, serum saturated fatty acids and self-reported diabetes four years later [11]. Dietary linoleic acid (LA), a polyunsaturated fatty acids (PUFA) estimated to account for 85-90% of dietary PUFA, was inversely associated with diabetes risk [11,12]. Likewise, in the prospective Nursesʼ Health Study, polyunsaturated fat intake was reported to lower relative risk of diabetes [13].
Obese adults and those with type-two diabetes are known to have higher circulating levels of free fatty acids than non-obese non-diabetic individuals [14]. Cross-sectional studies demonstrated that lean individuals have a greater proportion of LA, in serum fatty acids than obese individuals, who tend to have more serum fatty acid in general, and a greater proportion of saturated fatty acid intake such as palmitate [15]. MUFA and PUFA are thought to benefit serum lipid profiles by limiting hepatic steatosis and subsequently increasing lipid metabolism and decreasing lipogenesis [3,16]. A controlled study of supplemented LA intake demonstrated favorable decreases in total and LDL cholesterol but HDL and triglycerides were unchanged [17]. High PUFA diet has been shown to decrease LDL in small controlled studies, and high SFA to increase LDL [16,18]. Yet, studies analyzing MUFA in relation to PUFA on diabetes risk and its effect on serum lipid profile are limited in number [16].
The aim of the study was to examine the role of dietary consumption of different types of fatty acids on metabolic risk factors in middle-aged and older men and women. We hypothesized that SFA intake, and low intake of MUFA and PUFA would be associated with markers of insulin resistance, hyperlipidemia, and hypercholesterolemia in middle-aged and older overweight and obese men and women.
Methods
Male and female adults aged 45-80 years from the Baltimore/Washington area were eligible if overweight or obese (BMI 29-50 kg/m2) but otherwise healthy. Women were included only if they had undergone menopause for at least one year. Only adults who were weight stable (<2.0 kg weight change in past year) and sedentary (<20 min of aerobic exercise 2x/week) were recruited. Men and women were excluded for the presence of heart disease, diabetes, cancer, anemia, dementia untreated dyslipidemia, as well as those with other unstable or chronic diseases affecting the liver, lungs, or kidneys. Potential participants were screened and underwent a physical examination including a comprehensive past medical history, fasting blood profile, and a graded exercise treadmill test. Each study participant provided written consent. All methods and procedures were approved by the Institutional Review Board at University of Maryland and the VA Research and Development Committee.
Nutrition
Subjects were instructed by a registered dietician (RD) on how to complete a food record. Each subject completed a 5-day food record and recorded all foods eaten, and the estimated quantity of each food. Diet records were analyzed for macronutrient content, with lipids further recorded as SFA, MUFA, PUFA, omega 3, omega 6, Eicosapentaenoic Acid (EPA), Docosahexaenoic acid (DHA), trans-fatty acid and cholesterol, as well as sodium and fiber using Nutritionist Pro software. Additional analysis of the food records were performed with the USDA Foodapedia feature of the Super tracker program.
VO2 max
VO2 max was measured using a continuous treadmill test protocol [19].
Body composition
Height (cm) and weight (kg) were measured to calculate BMI. Percent body fat mass was determined by dual-energy X-ray absorptiometry (iDXA, LUNAR Radiation Corp, Madison, WI).
Oral Glucose Tolerance Test (OGTT)
After a 12-hour overnight fast, the subjects had a blood draw before and at 30-min intervals for 2 h after ingestion of 75 g glucose. Samples were collected in heparinized syringes, placed in pre chilled test tubes containing 1.5 mg EDTA/ml blood, centrifuged at 4°C and stored at -80°C until analysis. Plasma glucose concentrations were measured using the glucose oxidase method (2300 STAT Plus, YSI, Yellow Springs, OH). Plasma insulin was measured in duplicate by radioimmunoassay (RIA) (Millipore, St. Charles, MO). The subjects were defined by glucose tolerance status.
Lipoprotein lipids
Plasma triglyceride and cholesterol levels were averaged from two fasting blood draws analyzed using enzymatic methods (UniCel DxC880i, Beckman Coulter, Inc., Brea, CA) and high-density lipoprotein cholesterol (HDL-C) measured in the supernatant after precipitation with dextran sulfate (low-density lipoprotein cholesterol (LDL-C)=total cholesterol–(TG/5 + HDL-C)) [20].
Statistical analyses
Descriptive means were calculated on variables. Unpaired t-tests were used to test differences by sex. Pearson correlations and partial correlations were used to assess relationships between key variables. Statistical significance was set at a two-tailed P<0.05. Data were analyzed using SPSS (SPSS Inc., Chicago). Results are expressed as mean ± SEM.
Results
Phenotype and diet composition
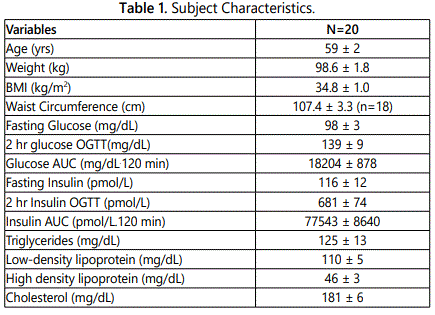
Descriptive characteristics of the subjects are provided in table 1. The subjects were 70% Caucasian and 30% African American and included 9 men and 11 women. Subjects had low fitness levels (VO2 max: 23.5 ± 2.4 ml/kg/min) and high total body fat (43.5 ± 1.7%). Fasting and OGTT results as well as lipoprotein lipid results are shown in Table 1. Twelve subjects had normal glucose tolerance (NGT) and seven subjects had impaired glucose tolerance (IGT).

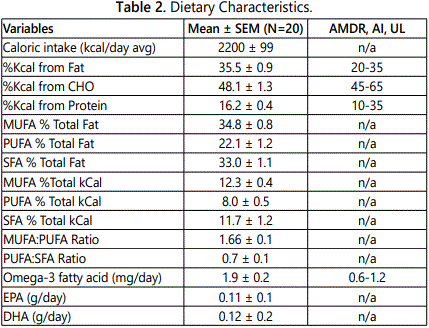
Dietary characteristics of the subjects are compared to national dietary reference intakes (DRI), including accepted macronutrient distribution range (AMDR) or adequate intake (AI), and are presented in Table 2 [21]. The average macronutrient composition of the diet is fairly homogenous. Diets were high in proportion of fat with roughly equal percentages of SFA and MUFA, whereas intake of PUFA intake had the lowest percent of total fat intake. No significant differences were noted in the diets between NGT and IGT subjects for percent of calorie intake for carbohydrate, protein, and fat (data not shown) or for daily intake of MUFA (31.0 ± 2.7 vs. 28.7 ± 3.4 g), PUFA (20.3 ± 1.9 vs. 18.2 ± 2.7 g) and SFA (29.3 ± 2.5 vs 27.0 ± 3.4 g), respectively.
Men on average consumed more total calories per day than women (2506 ± 110 vs. 1948 ± 110 kcal/d, P<0.005). Although men had higher carbohydrate, protein, and fat intake than women (all P<0.05), there were no significant differences between men and women for percent calories from carbohydrate (47.1 ± 1.9 vs. 49.0 ± 2.0), percent calories from protein (15.9 ± 0.8 vs. 16.5 ± 0.5), and percent calories from fat (35.8 ± 0.7 vs. 35.2 ± 1.6). Men had higher total MUFA intake than women (36.3 ± 2.0 vs. 25.8 ± 2.4 g, P<0.01) and MUFA as a percent of total fat intake (36.4 ± 1.0 vs. 33.4 ± 1.1%, P=0.05), with no difference between men and women in PUFA intake (22.0 ± 0.7 vs. 17.5 ± 2.5 g) or SFA intake (32.6 ± 3.2 vs. 25.5 ± 1.9 g).


Relationships of diet with glucose tolerance and lipids
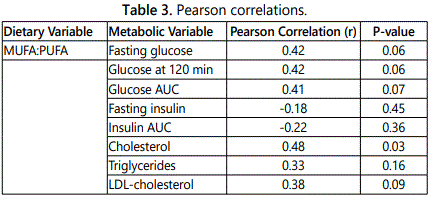
The ratio of total MUFA to PUFA was associated with serum cholesterol and tended to be associated with markers of glucose intolerance including fasting glucose and glucose AUC (Table 3). Total MUFA to PUFA ratio was not associated with fasting insulin or insulin AUC. Average daily PUFA intake tended to be associated with lower glucose at 120 min of the OGTT (r=-0.43, P=0.08). PUFA intake as a percentage of fat intake and the ratio of PUFA:SFA was associated with lower serum cholesterol (r=-0.44, P=0.05 and r=-0.40, P=0.07, respectively). Additionally, the ratio of omega-3 to omega-6 fatty acids was negatively correlated to insulin AUC (r=-.054, P=0.01).

Discussion
Our results indicate that overweight and obese subjects have a high dietary intake of fat as a percent of total caloric intake, especially SFA and MUFA. The dietary intake of SFA, MUFA and PUFA in our sample closely resembles those of the average American using NHANES data [22]. We did not find differences in dietary intake of fatty acids between adults with normal and impaired glucose tolerance. Greater MUFA intake compared to PUFA tended to be associated with glucose intolerance and higher serum cholesterol in these overweight and obese sedentary subjects.
Our results would suggest that dietary intake of PUFA confer some reduction in metabolic risk in terms of glucose metabolism and hypercholesterolemia. In a systematic review and meta-analysis of randomized controlled feeding trials, replacing carbohydrate intake with PUFA or replacing SFA with PUFA reduces blood glucose levels and insulin resistance and improves insulin secretion [23]. The association between PUFA intake and lower total cholesterol further support a potentially beneficial effect of PUFAs on various aspects of lipid metabolism.
In a small meta-analysis of four studies of adults with type-two diabetes that compared high-MUFA to high-PUFA diets, the MUFA groups had reductions in fasting plasma glucose [24]. Although our results appear to contradict this analysis, MUFA intake is confounded by its food source as it can reflect either consumption of meat and dairy products containing oleic acid, or of non-hydrogenated vegetable oils like olive oil or avocado. Thus, detailed food records of intake are necessary to further elucidate any conclusions.
The proportion of omega-3 intake to omega-6 may partly explain greater insulin sensitivity. This would be in concert with epidemiologic studies drawing attention to increasing ratios of omega-6 to omega-3 in the American diet over time and associations with obesity, as well as benefits to insulin sensitivity with supplementation of omega-3 fatty acids [25,26].
We did not find any significant associations of saturated fat intake with metabolic risk, likely due to the homogenous sample of overweight and obese adults. Our findings align with the longitudinal findings of the Nursesʼ Health Study, where Type 2 diabetes risk was not associated with total fat intake, saturated or monounsaturated fat intake [13]. Furthermore, analysis of a single fats alone, or proportions of fat groups in a dietary pattern, may not have been sufficient to relate to metabolic outcomes. In fact, inverse association are reported with percentage of energy derived from fat, SFA, MUFAs and PUFAs suggesting that overall composition may play a more important role than total amount of each type of fatty acid [27]. Using the National Health and Nutrition Examination Survey (NHANES) of over 24,000 participants, Mazidi et al. [28], reported that subjects who adhered to dietary patterns determined by a one-day 24 h food record either comprised of SFA, total fat, MUFA and CHO and or composed of PUFA, cholesterol, and protein had a higher likelihood of developing insulin resistance.
Analysis of diet composition in terms of individual nutrients should put the food in context; specifically that food is not composed simply of individual nutrients, but is a complex interplay of micro and macronutrients, influenced by its source, preparation, and by the other foods in a meal. This multi-layered context of a nutrient, as well as the metabolic characteristics of an individual, will determine the uptake, use, storage of said nutrient, as well as long term metabolic sequelae of any diet patterns.
Limitations of this study include the small sample size, relatively homogenous nature of the group, and inability to control for potential confounding factors such as age, sex, and race. In addition, the cross-sectional design of the present study does not allow investigation of the impact of dietary fat composition on the development of diabetes as in a followup study. However, the strengths of the study include a thorough analysis of dietary intake with a 5-day dietary intake and careful characterization of the subjects including measures of fitness by VO2 max testing, glucose metabolism by oral glucose tolerance test, and lipoprotein lipid profiles which were measured twice and averaged.
Conclusion
In conclusion, dietary MUFA intake, unbalanced by PUFA was associated with glucose intolerance and increased serum cholesterol, and therefore may confer increased risk for diabetes among obese, sedentary individuals. Further investigation could potentially aim to analyze the source of dietary fat, as well as meal patterns. Individualized dietary recommendations could therefore aim to incorporate food source and context of dietary lipids to promote healthy eating habits and potentially alter metabolic risk.
Acknowledgments
This research was supported funds from a Senior Research Career Scientist Award (ASR) from the United States Department of Veterans Affairs (VA) Rehabilitation R&D (Rehab RD) Service, VA Merit Award (ASR) Clinical Service R&D, VA Medical Center Baltimore Geriatric Research, Education and Clinical Center (GRECC), National Institutes of Health Grant P30-AG028747, and P30 DK072488.
References
- Lichtenstein AH, Schwab US. Relationship of dietary fat to glucose metabolism. Atherosclerosis. 2000; 150(2): 227-243. doi: 10.1016/s0021-9150(99)00504-3
- Borkman M, Storlien LH, Pan DA, Jenkins AB, Chisholm DJ, Campbell LV. The relation between insulin sensitivity and the fatty-acid composition of skeletal-muscle phospholipids. N Engl J Med 1993; 328(4): 238-244. doi: 10.1056/NEJM199301283280404
- Silva Figueiredo P, Carla Inada A, Marcelino G, et al. Fatty Acids Consumption: The Role Metabolic Aspects Involved in Obesity and Its Associated Disorders. Nutrients. 2017; 9(10): E1158. doi: 10.3390/nu9101158
- Corcoran MP, Lamon-Fava S, Fielding RA. Skeletal muscle lipid deposition and insulin resistance: effect of dietary fatty acids and exercise. Am J Clin Nutr. 2007; 85(3): 662-677. doi: 10.1093/ajcn/85.3.662
- Pan DA, Lillioja S, Milner MR, et al. Skeletal muscle membrane lipid composition is related to adiposity and insulin action. J Clin Invest. 1995; 96(6): 2802-2808. doi: 10.1172/JCI118350
- Kim JY, Hickner RC, Cortright RL, Dohm GL, Houmard JA. Lipid oxidation is reduced in obese human skeletal muscle. Am J Physiol Endocrinol Metab. 2000; 279(5): E1039-E1044. doi: 10.1152/ajpendo.2000.279.5.E1039
- Risérus U, Willett WC, Hu FB. Dietary Fats and Prevention of Type 2 Diabetes. Prog Lipid Res. 2009; 48(1): 44-51. doi: 10.1016/j. plipres.2008.10.002
- Thanopoulou AC, Karamanos BG, Angelico FV, et al. Dietary fat intake as risk factor for the development of diabetes: multinational, multicenter study of the Mediterranean Group for the Study of Diabetes (MGSD). Diabetes Care. 2003; 26(2): 302-307. doi: 10.2337/diacare.26.2.302
- van de Laar FA, van de Lisdonk EH, Lucassen PL, et al. Fat intake in patients newly diagnosed with type 2 diabetes: a 4-year follow-up study in general practice. Br J Gen Pract. 2004; 54(500): 177-182.
- Wang L, Folsom AR, Zheng ZJ, Pankow JS, Eckfeldt JH, ARIC Study Investigators. Plasma fatty acid composition and incidence of diabetes in middle-aged adults: the Atherosclerosis Risk in Communities Study. Am J Clin Nutr. 2003; 78(1): 91-98. doi: 10.1093/ajcn/78.1.91
- Hodge AM, English DR, OʼDea K, et al. Plasma Phospholipis and dietary fatty acids as predictors of type 2 diabetes: interpreting the role of linoleic acid. Am J Clin Nutr. 2007; 86(1): 1891-197. DOI: 10.1093/ajcn/86.1.189
- Harris WS, Mozaffarian D, Rimm E, et al. Omega-6 Fatty Acids and Risk for Cardiovascular Disease: A Science advisory from the American Heart Association Nutrition Subcommittee of the Council on Nutrition, Physical Activity, and Metabolism; Council on Cardiovascular Nursing; and Council on Epidemiology and Prevention. Circulation. 2009; 119(6): 902-907. doi: 10.1161/CIRCULATIONAHA.108.191627
- Salmerón J, Hu FB, Manson JE, et al. Dietary fat intake and risk of type 2 diabetes in women. Am J Clin Nutr. 2001; 73(6): 1019-1026. doi: 10.1093/ajcn/73.6.1019
- Belfort R, Mandarino L, Kashyap S, et al. Dose-response effect of elevated plasma free fatty acid on insulin signaling. Diabetes. 2005; 54(6): 1640-1648. doi: 10.2337/diabetes.54.6.1640
- Vessby B. Dietary fat and insulin action in humans. Br J Nutr. 2000; 83: S91-S96. doi: 10.1017/s000711450000101x
- Ooi EM, Watts GF, Ng TW, Barrett PH. Effects of Dietary Fatty Acids on Human Lipoprotein Metabolism: A Comprehensive Update. Nutrients. 2015; 7(6): 4416-4425. doi: 10.3390/nu7064416
- Summers LK, Fielding BA, Bradshaw HA, et al. Substituting dietary saturated fat with polyunsaturated fat changes abdominal fat distribution and improves insulin sensitivity. Diabetologia. 2002; 45(3): 369-377. doi: 10.1007/s00125-001-0768-3
- Turner JD, Le NA, Brown WV. Effect of changes dietary fat saturation on low-density lipoprotein metabolism in man. Am J Physiol. 1981; 241(1): E57-E63. doi: 10.1152/ajpendo.1981.241.1.E57
- Ryan AS, Ortmeyer HK, Sorkin JD. Exercise with calorie restriction improves insulin sensitivity and glycogen synthase activity in obese postmenopausal women with impaired glucose tolerance. Am J Physiol Endocrinol Metab. 2012; 302(1): E145-E152. doi: 10.1152/ajpendo.00618.2010
- Warnick GR, Benderson J, Albers JJ. Dextran sulfate-Mg2+ precipitation procedure for quantitation of high-density-lipoprotein cholesterol. Clin Chem. 1982; 28(6): 1379–1388.
- U.S. Department of Health and Human Services, U.S. Department of Agriculture. Dietary Guidelines for Americans 2015–2020. 8th Edition. 2015. https://health.gov/dietaryguidelines/2015/guidelines/
- Rehm CD, Peñalvo JL, Afshin A, Mozaffarian D. Dietary Intake Among US Adults, 1999-2012. JAMA. 2016; 315(23): 2542-2553. doi: 10.1001/jama.2016.7491
- Imamura F, Micha R, Wu JH, et al. Effects of Saturated Fat, Polyunsaturated Fat, Monounsaturated Fat, and Carbohydrate on Glucose-Insulin Homeostasis: A Systematic Review and Meta-analysis of Randomised Controlled Feeding Trials. PLoS Med. 2016; 13(7): e1002087. doi: 10.1371/journal.pmed.1002087
- Qian F, Korat AA, Malik V, Hu FB. Metabolic Effects of Monounsaturated Fatty Acid-Enriched Diets Compared With Carbohydrate or Polyunsaturated Fatty Acid-Enriched Diets in Patients With Type 2 Diabetes: A Systematic Review and Meta-analysis of Randomized Controlled Trials. Diabetes Care. 2016; 39(8): 1448-1457. doi: 10.2337/dc16-0513
- Simopoulos AP. An Increase in the Omega-6/Omega-3 Fatty Acid Ratio Increases the Risk for Obesity. Nutrients. 2016; 8(3): 128. doi: 10.3390/nu8030128
- Fontani G, Corradeschi F, Felici A, et al. Blood profiles, body fat and mood state in healthy subjects on different diets supplemented with Omega-3 polyunsaturated fatty acids. Eur J Clin Invest. 2005; 35(8): 499-507. doi: 10.1111/j.1365-2362.2005.01540.x
- Welch AA, MacGregor AJ, Minihane AM, et al. Dietary fat and fatty acid profile are associated with indices of skeletal muscle mass in women aged 18-79 years. J Nutr. 2014; 144(3): 327-334. doi: 10.3945/jn.113.185256
- Mazidi M, Kengne AP, Mikhailidis DP, Toth PP, Ray KK, Banach M. Dietary food patterns and glucose/insulin homeostasis: a cross-sectional study involving 24, 182 adult Americans. Lipids Health Dis. 2017; 16(1): 192. doi: 10.1186/s12944-017-0571-x


